 Curvewire
For finance teams, lenders and analysts
Every Monday: US rates and macro, on one page.
One brief built from the Treasury's daily yield curve and the Bureau of Labor Statistics each week: every tenor's move, spreads and inversions, TIPS real yields and breakevens, 16 headline macro series, and CSVs plus a script that gives you the Treasury rate for any term.
- — 10-year Treasury
- — 10y–2y spread
- — CPI, 12 months
- About $2 an edition

This week, free: the latest curve
Loading this week's numbers from the latest edition…
| Tenor | Yield | 1 week | 52 weeks |
|---|
curve_rate.py.Sources: US Treasury daily par yield curve and BLS bulk files, read on the edition date. Want the raw history instead? The free Curvewire dataset has the full curve since 1990.
Look inside the 27 Sep 2026 edition
Real pages, rendered from the brief. Tap to enlarge.


Curvewire Brief: US Rates & Macro, Weekly Edition
- The yield curve now vs 1, 4 and 52 weeks ago, 1 month to 30 years, in one chart
- Every tenor's move in basis points and where it sits in its 52-week range
- Spreads and inversions: 10y–2y and 10y–3m now, a week and a year ago, with the last sustained inversion
- Real yields and breakeven inflation from the TIPS curve, 5 to 30 years
- Macro dashboard: CPI and core, shelter, energy, PPI, payrolls, wages, unemployment, participation, JOLTS: 16 series with 1- and 12-month changes
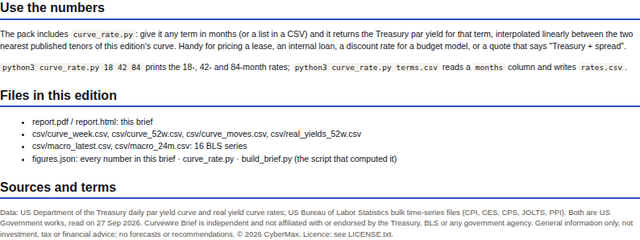
- Rate for any term:
curve_rate.pyprices 18, 42 or 84 months, or a whole CSV of terms - Files: PDF, HTML, 6 CSVs, figures.json and the script behind every number
Good for Monday finance meetings, "Treasury + spread" quotes, lease and loan pricing, budget discount rates, board packs and economics classes (quote facts with credit).
Secure checkout by Polar (cards, Apple Pay, Google Pay). Your first edition is available the moment you subscribe.
How it compares
| Curvewire Brief | treasury.gov + bls.gov | Free chart sites* | |
|---|---|---|---|
| Every tenor's weekly move + 52-week range | yes, one table | raw daily table | chart of today's curve |
| Spreads + inversion history | yes | compute it yourself | some |
| TIPS breakevens | 5 to 30 years | compute it yourself | rarely |
| CPI, jobs, wages, JOLTS in the same pack | 16 series | separate releases | no |
| CSVs + rate-for-any-term script | 6 CSVs + scripts | CSV per table | no |
| Price | $9/mo, $79/yr | free | free with ads |
* Checked 27 Sep 2026: ustreasuryyieldcurve.com, longtermtrends.com and investing.com show yield-curve charts or quotes; none ships a weekly pack with macro series and files. The data itself is free at the agencies: the brief saves the Monday assembly.
FAQ
Why not treasury.gov and bls.gov directly?
They're the official source and every number here comes from them. They publish raw tables one release at a time, though. The brief is the week on one page: moves for every tenor, 52-week ranges, spreads and inversions, breakevens and the macro dashboard, plus CSVs and the script that computed each number.
How do I get the Treasury rate for an 18-month or 7-year term?
Each edition has curve_rate.py (Python 3, nothing to install). Run python3 curve_rate.py 18 84, or pass a CSV with a months column to get rates.csv. It interpolates linearly between the two nearest published tenors of that week's curve.
Which macro series are included?
CPI (headline and core, seasonally adjusted and not), food, energy, shelter, PPI final demand, nonfarm payrolls, average hourly earnings and weekly hours, the unemployment rate, participation, the employment-population ratio, JOLTS job openings and the quits rate.
When does a new edition arrive, and can I cancel?
Every Monday. The new PDF and zip replace the previous files in your Polar customer portal. Cancel any time from the portal; yearly plans renew once a year.
Is this investment advice?
No. It's an independent report built from public US Treasury and BLS data (US Government works), with no forecasts or recommendations, and isn't affiliated with any agency. General information only, not investment, tax or financial advice.
Can I share it?
Use it inside your business, household or classroom, and quote facts with the credit "Source: Curvewire Brief by CyberMax, from US Treasury and BLS data". Please don't re-publish the files or forward your download links.